Tutorial 2: Creating a Flowsheet with Linked Simulations
Note
This tutorial requires the user to have Aspen Custom Modeler installed on their machine.
Note
This tutorial utilizes SimSinter and Turbine, two optional software packages that integrate with FOQUS to run Aspen and Excel models. The installation instructions are located at Install Turbine and SimSinter (Windows Only).
This tutorial is referenced by other tutorials. Save the flowsheet in a convenient location for future use.
This tutorial demonstrates how to link simulations to nodes, and how to connect nodes in a flowsheet. Two models are used: (1) a bubbling fluidized bed model in ACM and (2) a cost of electricity (COE) model in Excel. The COE model estimates the cost of electricity for a 650 MW (net before adding capture) supercritical pulverized coal power plant with solid sorbent post combustion CO\(_2\) capture process added.
The files for this tutorial is located in:
examples/test_files/Optimization/Model_Files.
Note
The examples/ directory refers to the location where the FOQUS examples were installed, as described in Install FOQUS Examples.
Start FOQUS. The Session window displays (Figure Session Setup).
Enter “BFB_opt” in Session Name (without quotes).
Click the Description tab. The problem description box displays and is shown in (Figure Session Description).
In the problem description box enter information about the problem being solved in the FOQUS session; this information can be more extensive than what is shown in the example.
Save the session file. Click Save Session from the Session drop-down menu. Enter change log information and a file name when prompted. The Creation Time in metadata page will be the time the session is first saved. The Modification Time will be the last time the session was saved. The ID is a unique identifier that changes each time the user saves the simulation. The Change Log tab provides a record of the changes made each time the session is saved.

Session Setup

Session Description
There are two models needed for this optimization problem: (1) the ACM model for
the BFB capture system and (2) the Excel cost estimating spreadsheet. These
models are provided in the examples/test_files/Optimization/Model_Files directory. There are two SimSinter configuration
files: (1) BFB_sinter_config_v6.2.json for the process model and (2)
BFB_cost_v6.2.3.json for the cost model. The next step is to upload the models
to Turbine.
Open the Add/Update Model to Turbine dialog box (Figure Open Upload to Turbine Dialog).
In this case, the SimSinter configuration files have already been created. If a SimSinter configuration file needs to be created for the simulation, Create/Edit displays the SimSinter configuration GUI (see Figure Upload to Turbine Dialog). See the SimSinter documentation or Chapter Simulation Standard Interface (SimSinter) for more information.
Click Browse to select a SimSinter configuration file (Figure Upload to Turbine Dialog). Once the SimSinter configuration file is selected, the simulation file and sinterconfig file is automatically added to the files to upload. The application type is entered automatically. If there are additional files required for the simulation, those files can be added by clicking Add File.
Enter the simulation name in Simulation Name. This name is determined by the user, but will default to the SimSinter configuration file name. For this tutorial use BFB_v6_2.
Click OK to upload the simulation.
- Repeat the upload process for the cost model. Name the modelBFB_v6_2_Cost.

Open Upload to Turbine Dialog

Upload to Turbine Dialog
The next step is to create the flowsheet. Figure Flowsheet Editor illustrates the steps to draw the flowsheet.
Click Flowsheet at the top of the Home window.
Click Add Node mode.
Add two nodes to the flowsheet. Name the first node “BFB” and the second node “cost”.
Click Add Edge mode.
Click the BFB node followed by the cost node.
Click Selection mode and select the BFB node.
Click Toggle Node Editor. The Node Editor displays as illustrated in Figure Node Editor.

Flowsheet Editor
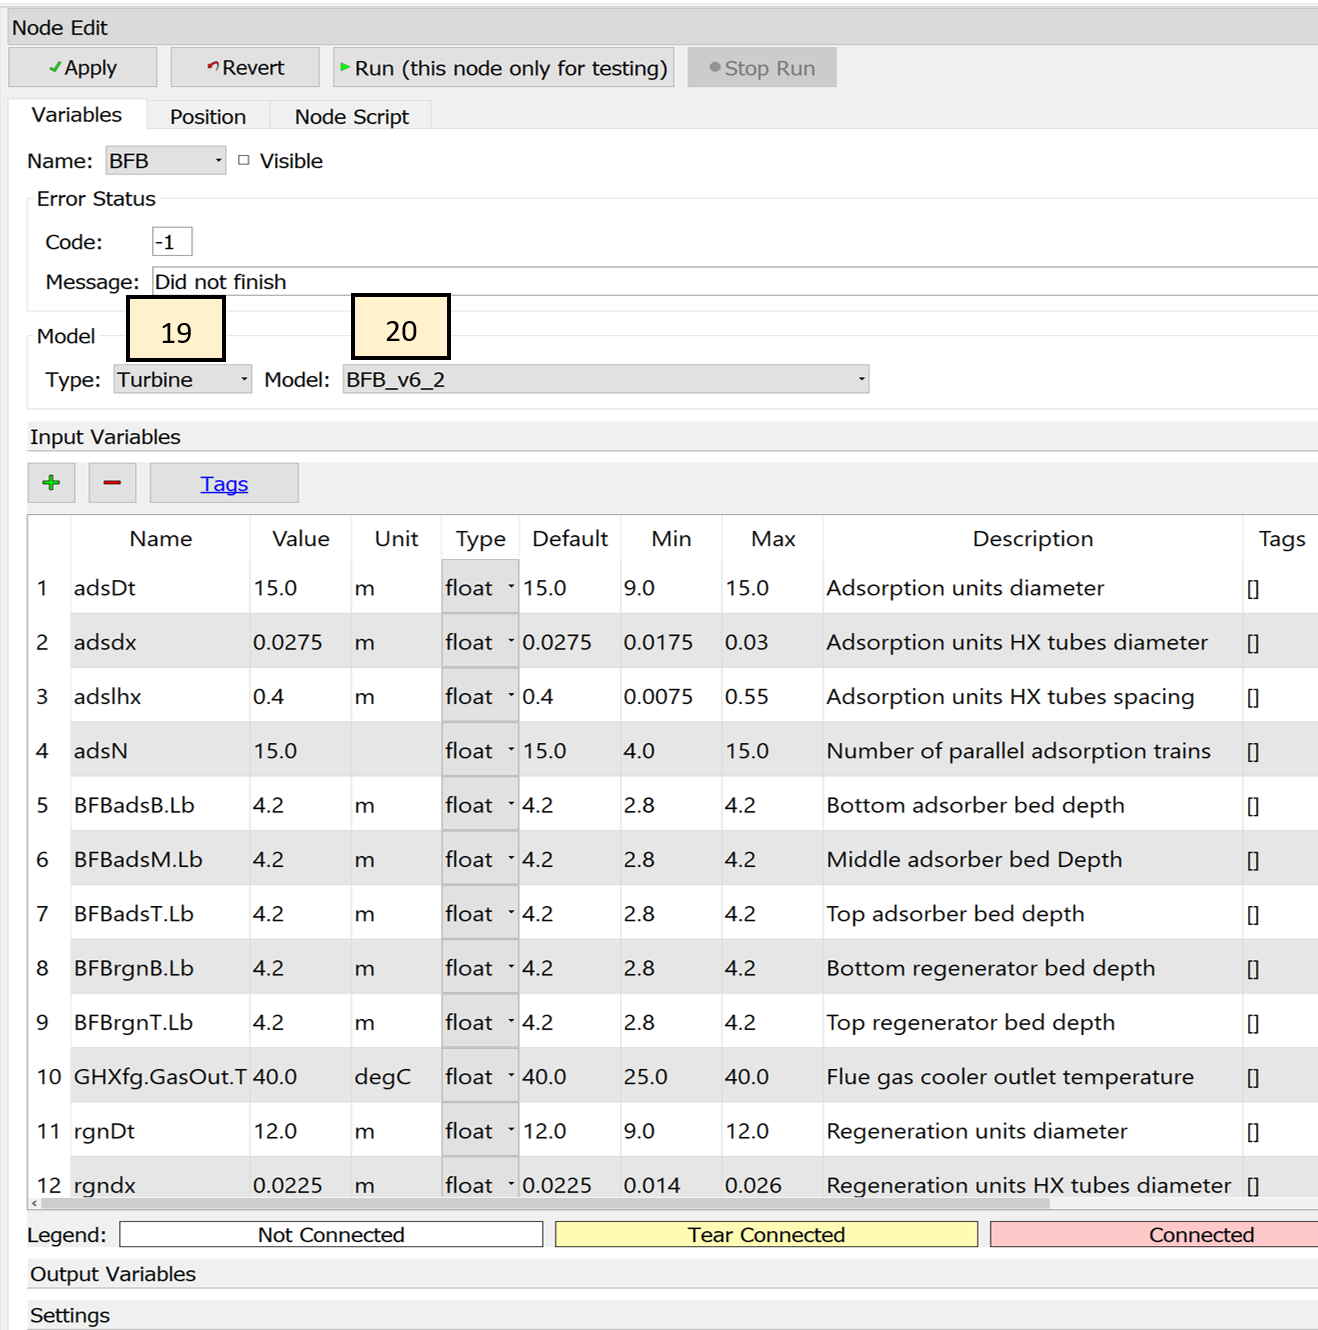
Each node must be assigned the appropriate simulation. Use the Node Editor to set the simulation type and the simulation name from simulation uploaded to Turbine. The Node Editor is illustrated in Figure Node Editor
Under Model and Type, set the simulation Type to Turbine. This indicates that the simulation is to be run with Turbine.
Under Model, set the simulation of the BFB node to BFB_v6_2.
The Variables and Settings are automatically populated from the SimSinter configuration file. Variable values, Min/Max, and descriptions can be changed; however, for this problem, the values taken from the SimSinter configuration should not be changed.
Repeat the process for the cost node, assigning it the BFB_v6_2_cost simulation.
Node Editor
The connections between variables in the BFB simulation and the cost estimation spreadsheet must be set, so that required information can be transferred from the BFB simulation to the cost simulation.
Click Toggle Node Editor to hide the Node Editor (Figure Flowsheet Editor).
Select the edge on the flowsheet with the Selection tool.
Click Toggle Edge Editor to show the Edge Editor. The Edge Editor is shown in Figure Edge Editor.
For convenience, all of the variables that should be connected from the ACM model to the Excel spreadsheet have been given the same names in their SimSinter configuration files. To connect the variables click Auto in the Edge Editor. Auto connects variables of the same name. Since this is often not desired, the Auto button should be used carefully. There should be 46 connected variables.

Edge Editor
The flowsheet should now be ready to run. Test the flowsheet by executing a single evaluation before setting up the optimization problem.
Click Run in the Flowsheet Editor (Figure Flowsheet Editor).
The flowsheet may take a few minutes to run. The BFB simulation takes a significant amount of time to open in ACM. While running optimization, the evaluations take less time because the simulation remains opened. The simulation should complete successfully. A message box displays when the simulation is done. The status bar also indicates the simulation is running.
While the simulation is running, Stop is enabled.
Once the simulation runs successfully, Save the FOQUS session again, and keep it for use in later tutorials.